
K-Means is one of the most famous and widely used algorithm on Machine Learning field. In this post we are going to use KMeans to reduce the colors on images(no pixel reducing done) and therefore reduce their size as well. No knowledge on the field is required and an friendly user interface is provided together with executable application file(150MB because of long spark dependencies). So you can easily experiment on your own with different images(same examples in last section). Full working code is available on github.
KMeans Algorithm
KMean is an unsupervised learning algorithm that classifies similar data together into categories/clusters. It is unsupervised because the data are not labeled and algorithm does not need any hint or feedback for categorizing similar data together, just maybe the number of expected categories.(more on this later).
Applications
Customer Focus
You have a big amount of data related to your customers and want to find out the type of customers you have so you know how to develop your business better in serving specific groups. Our maybe you want to produce Jeans and T-shirts and want to know how people in the targeted country are group by their size so you know what sizes will fit better into population.
Organize Computing in Clusters
Would be better from performance perspective if you group certain computer in cluster together.For example those that exchange often or are near from network perspective or serve similar computations and so on.. SO KMeans can group similar computer in cluster together and we can developer better layouts and optimizations.
Social Networks
In Social network you can actually group people by a lot of factors, their relations , preferences, certain similarities and target them better from marketing point of view. So based on the input of data we give, KMeans can help us categorize same date from different perspectives and you those to optimize adds.
Astronomical Data Analysis
KMeans is also used in understanding galaxy formation and search for certain cohesion in astronomical data.
How it works
KMeans operates into two steps.Lets say we want to categorize our date into 4 groups(later we show that even this can be find out).
STEP 0: Before starting any of the steps it randomly picks 3 samples from data known as cluster centroids.
STEP 1 : In first step it checks each of the data samples and categorize them in one of the 3 groups depending on how similar they are with cluster centroids, randomly chosen at the beginning.
STEP 2: In the second step it moves cluster centroids a little bit more close to their similar(categorized at Step 1). It repeats step 1 and step 2 until until there is no significant movement of cluster centroids. Below is plotted an execution of algorithm with simple data(image source ).

Step 1
In this section is given a slightly more formal explanation of how the Step 1 is implemented. If not familiar with multidimensional feature data please refer here. Lets name some variables like below:
k – number of clusters
Xij – example i with feature j
μij – cluster centroid i with feature j(Similar to example X, after all centroid was just a randomly picked example)
At this step we are iterating through examples and calculate how similar they are with the centroids(we have one centroid for category) and put it on the category they are more similar with. More formally this done by calculating the euclidean distance of the example from centroid and pick the centroid from which we have the smallest distance. Since centroid is just a randomly example we sum all features euclidean distance between centroids and each example.
![]()
or more simplified and with less computation:
![]()
Step 2
What this step is doing graphically is just moving centroids a little more closely to the similar examples categorized in step 1. More formally we calculate the new position of centroid by taking the average of all examples similar to him or belonging to him(categorized by step 1). So for example if we have 4 clusters and 103
examples and after step 1 suppose we have the following outcome:
μ1=20 examples categorize similar to centroid 1 from index 1 to 20
μ2=10 examples categorize similar to centroid 2 from index 21 to 31
μ3=30 examples categorize similar to centroid 3 from index 32 to 62
μ4=40 examples categorize similar to centroid 4 from index 63 to 103
the new centroids will be calculated as follow
![]()
![]()
![]()
![]()
so basically is just an average calculation of all data similar to particular centroid.
Repeat.When to stop?
We are repeating step 1 and step 2 with new calculated centroids until graphically the centroids move closer and closer to the clusters of data. Since the algorithm will run forever and we need to explicitly tell when we are satisfied with the result so it can stop. And one way to tell that graphically is when iteration by iteration the centroids are not moving any more or moving very little. Formally we can calculate the so called Cost Function which is basically the average of what we did as step 1 like below :
![]()
where μc is the centroid for particular Xi example as we know each example can be part of different groups or centroids. Each iteration cost is compared to the previous cost. If the change is really low than we stop, for example we can define that if the improvement(difference of cost functions) is 0.00001 it makes not sense to continue anymore or any other value we find suitable.
Can it go wrong?
Usually not but it is known that KMeans can stuck at so called Local Optima instead of Global Optimum. In that case can happen KMeans fail to discover even obvious groups like below graph:
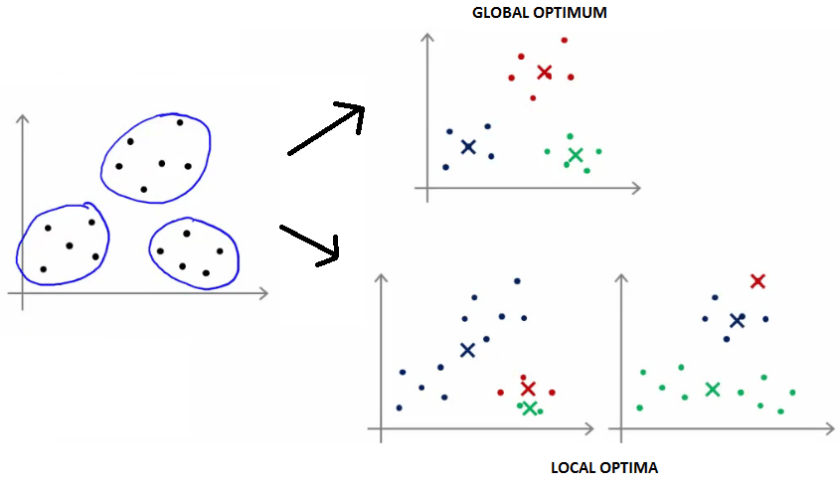
Fortunately the solution is fairly easy just to run the KMeans several times and pick the best result registered. This solution helps because at the very beginning Step 0 we randomly initialize KMeans and is very rare if we run lets say 10 times to have all local optima. Of course this increase a bit the running time as it runs several times and only one result is needed but on the other hand is fully possible to run on parallel or even different clusters so usually is fairly acceptable as working solution.
Of course there is more about KMeans and the things that can go wrong or good so I highly recommend this article for more deep insight.
Algorithm Execution and Results
In this section instruction to execute the running application (also possible through downloading the code) are given and the results are presented together with some details how KMeans helps with color reduction.
Color Reduction
Is important to clarify that KMeans is not reducing the pixels on image but rather is reducing number of colors an image has by grouping similar colors together. A normal image usually have thousands or even more colors so reducing number of colors can dramatically decrease the file size.
To clarify how reducing the number of colors helps with reducing the image size an example is taken. Lets suppose we have an image with 1280X1024 pixels and for each pixel a simple color representation RGB 24 bit -> 8 bit Red, 8 bit Green, 8 bit Blue. In total we need 1280 * 1024 * 24=31.457.280 bits or 30MB to represent the image. Now lets say we reduce the overall colors to 16. This means that we do not need anymore 24 bit for each pixel but 4 bit to represent only 16 colors. So now we have 1280 * 1024 * 4=5MB , in a few words 6 times less memory. Of course our image will not look that perfect as it was before(it has only 16 colors now) but we can certainly find a middle point.
Execution and Results
The easiest way to execute the algorithm on is to download the jar and just execute with your own images(you need JAVA installed on your machine). It takes in my computer (deepening on image of course) approx. 1 minute to reduce colors to 16(please expect high CPU and memory usage since SPARK is running in parallel). In the user interface you can choose the image file you want to try and also the numbers of color to reduce the image. Please find below an example of the user interface and results as well:

As we can notice the file size is reduced with a factor of 4 and the final image does not look that bad. Running several times it may bring better results but lets see below another try with 24 colors:

This looks noticeable better and the size is not increased a lot(just 0.08MB). It looks that maybe 24 to 28 lies the best visual result for this image.
Although the results look quite good I would say that choosing the best image is manual, after wall we are executing and picking what looks best to the eye. I believe that this problem can be solved in a number of different ways.
One of the solutions would be simple to count all colors on original image and from there define numbers of colors that the image still looks ok to the eye. And this process can be done by using Machine Learning Prediction Algorithm like “Linear Regression”. So we train fist the algorithm by giving images with different colors and in the same time say for each of them what looks good. After giving a significant examples like this the algorithm learned pretty much what is the best color to reduce depending on different images. Now is the time to let Linear Regression Algorithm predict for the next image what will be the reduced colors number.
It is possible to download the code and run on Java IDE through executing class Run. Or if you do not feel to run from source simply download the code and run maven: mvn clean install exec:java..